
Get More Data Insights With the Latest Analytics Updates
We know how important it is for creators to measure the impact of their hard work. That’s why we’re excited to share that we’ve upgraded another important effects experience: Effect House Analytics.
The new Analytics dashboard allows you to evaluate more easily how your effects perform and how people interact with them. Along with an upgraded design, we’ve also added more data and insights into your effects, empowering you to better understand their performance, create more dynamic effects, and reach the right audiences across TikTok.
What’s New in Analytics
The new Analytics dashboard is divided into three sections: Overview, Audience, and Manage effects. All data in Analytics are displayed in your local time and will update every 24 hours.
Overview
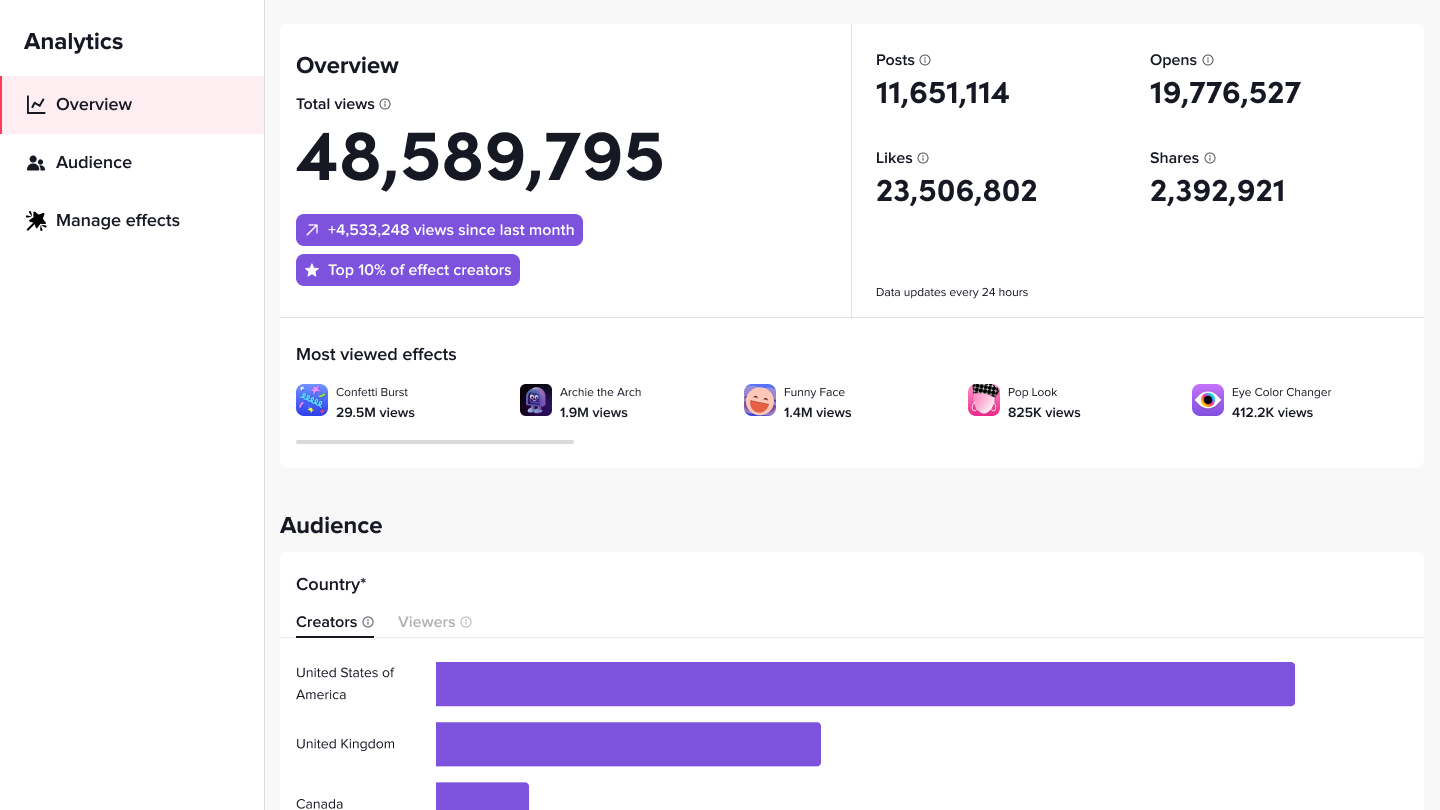
The Overview section provides a snapshot of how your effects are performing as a whole. It gives you the total number of views, posts, likes, opens, and shares for all the effects you published. It also gives you an insight into how much your effects’ total views increased from 30 days ago, and if you’ve made it to our top creators list.
Audience
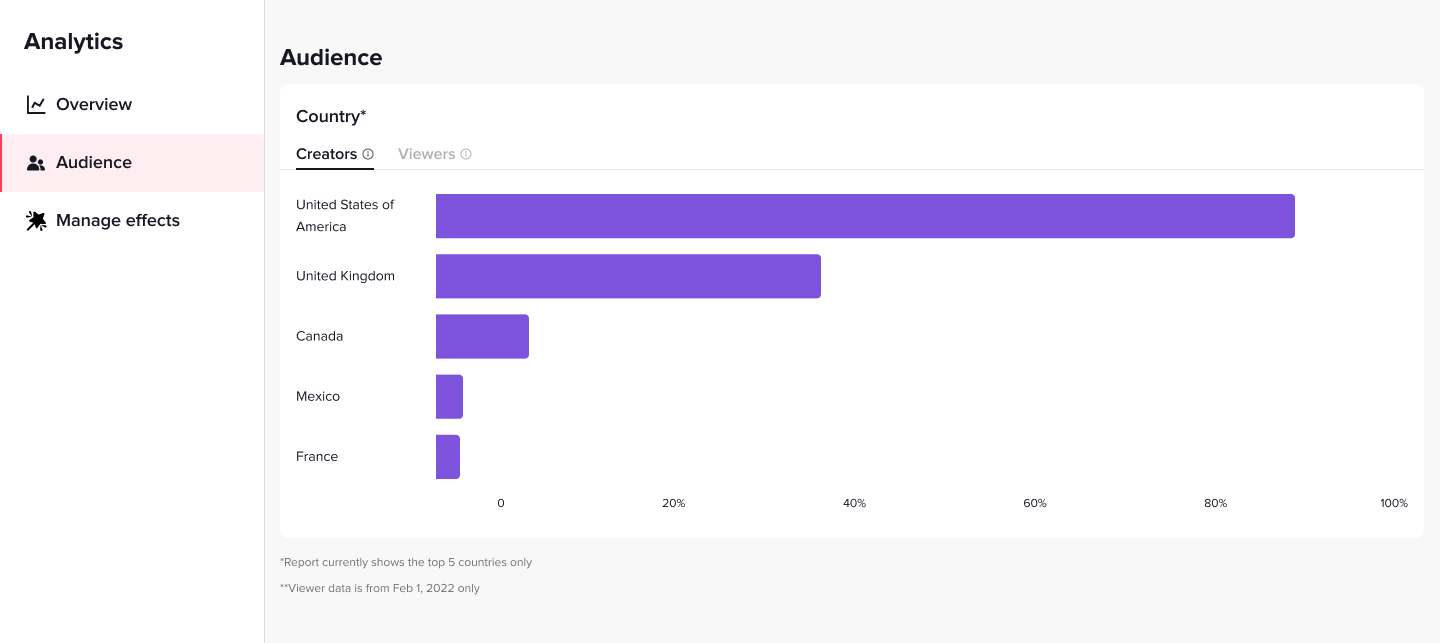
The Audience section gives you an insight into where in the world your effect is being used. You’ll get a sense of the regions where people are using your effects in videos, and the regions where people are watching videos featuring your effects.
Manage Effects
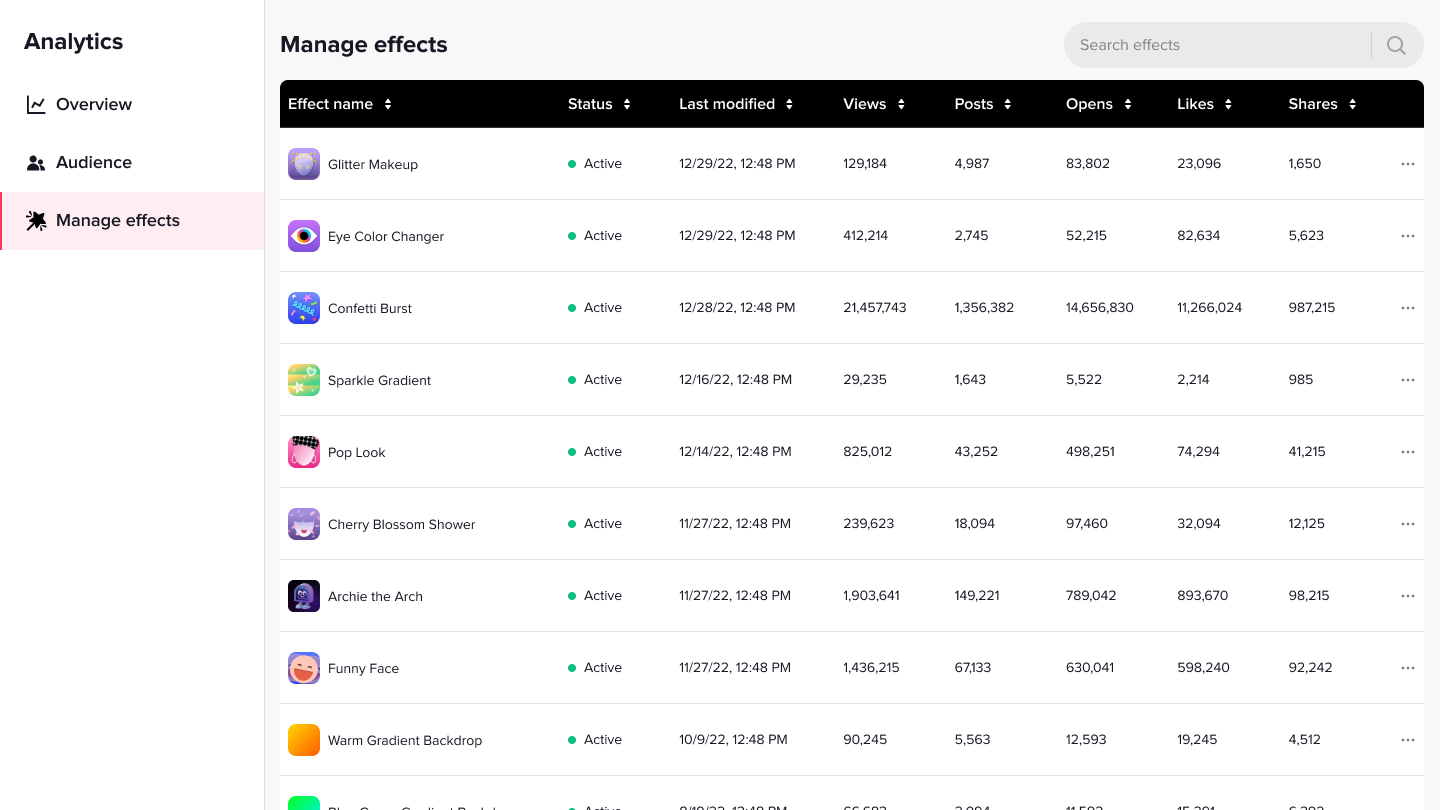
The Manage effects section lists all effects you’ve submitted and published. This section conveniently shows you the status of each effect, when you last modified them, and the total number of views, posts, likes, opens, and shares. You can also share, deactivate, and delete any effect directly from this section. To make it easy for you to search for your effects, we’ve also added a search bar at the top of this section.
Effects Details Page
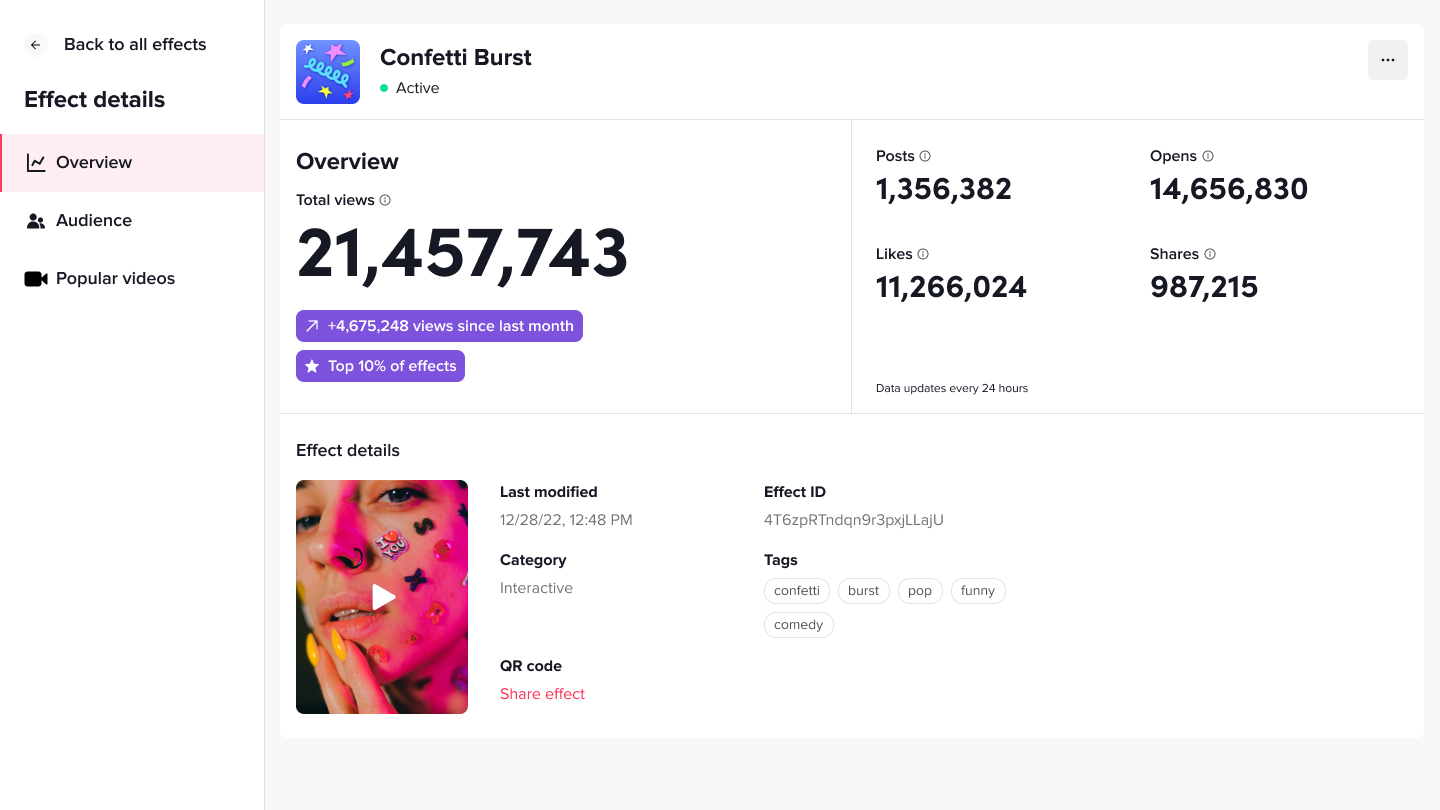
From the Manage effects section, you can click any effect to go to the Effect details page. On this page, you’ll also find an Overview section, which shows the total number of views, posts, likes, opens, and shares for a particular effect. You’ll also see how much this effect’s total views increased from 30 days ago, as well as its rank among all Community Effects. Below the Overview section, you’ll find more information about your effects, as well as your audience.
Most Popular Videos
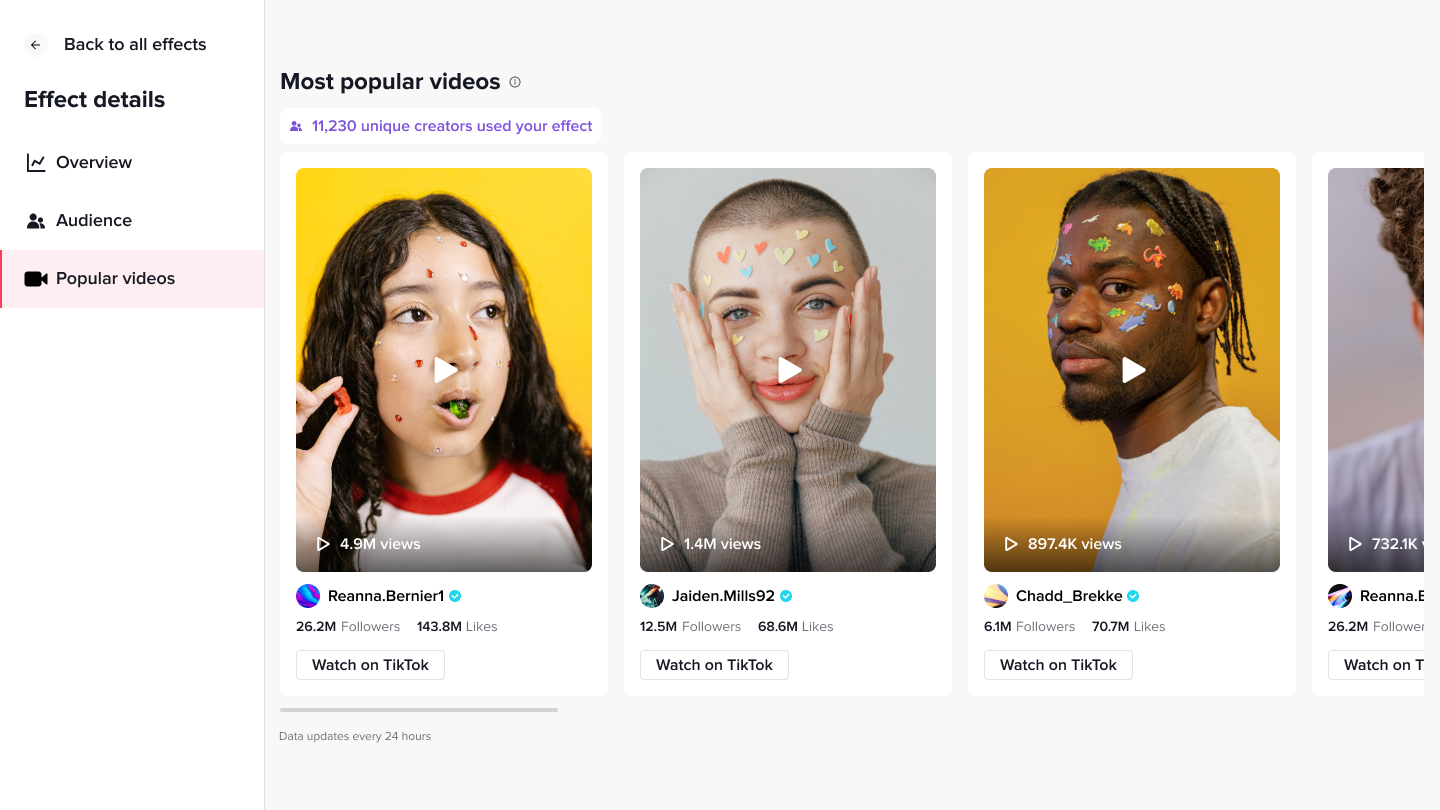
Curious to see how your effects are making waves across TikTok? On this page, we’ve added the Most popular videos section, which shows the number of creators who have used your effect, which creator is contributing the most views, and the top videos using your effects. You can also play the videos directly from within this section.
We hope these new Analytics features encourage you to create more standout effects, reach the right audiences, and use insights to fuel continued creativity! Check out Learning Resources for more information about the metrics tracked in Analytics and how to manage your effects.
