Visual Scripting Module 1: Introduction to Visual Scripting
In Effect House, visual scripting allows you to create interactive effects without having to worry about writing text-based code!
What Is Visual Scripting?
Visual scripting is a node-based creation system where each node performs a different function within your visual scripting graph, which is essentially a visually mapped-out program. When nodes are connected, they receive and pass information along the sequence. This system of connections allows you to add triggers, events, controllers, and more to your effects.
What Are Visual Scripting Nodes
Nodes are the building blocks of visual scripting. They are used to carry out different functions, operations, and commands within your visual scripting graph.
There are a variety of nodes, each of which performs a specific function. For example nodes can be used to multiply two values together, set the value of a property, or even command the next node to activate when a certain facial expression is detected.
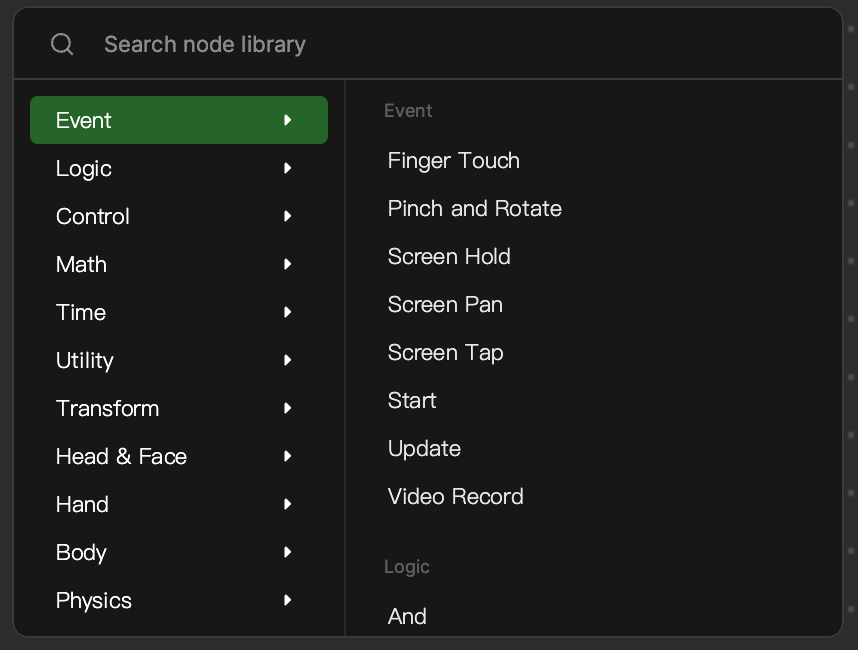
You can view all nodes, broken down into 11 categories, within the Node menu. The color of each node corresponds to the category it belongs to.
You can also control objects or properties by adding them as nodes to Visual Scripting panel. For example, you can drag an object from the Hierarchy panel and drop it in the Visual Scripting panel to add it as a node. You can also get or set component properties by clicking the circular button next to the property name in the Inspector panel. Learn more about get and set in the next module.
Anatomy of a Node
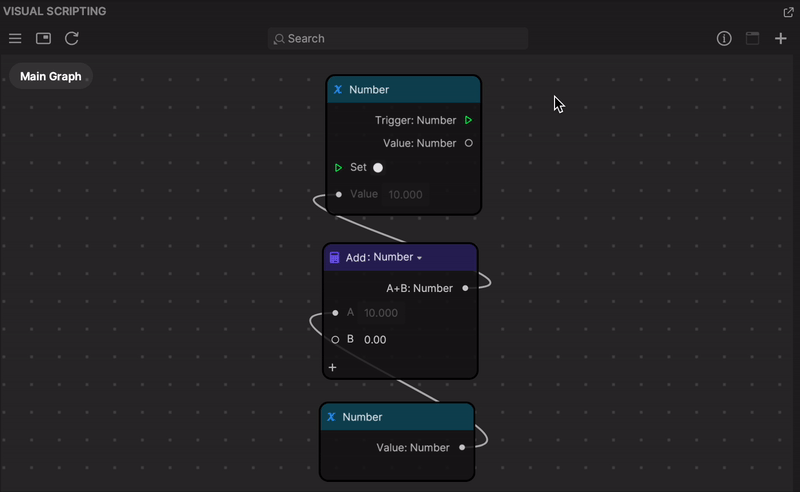
All nodes share common elements. Take a look at the Set Image node from the Utility category.
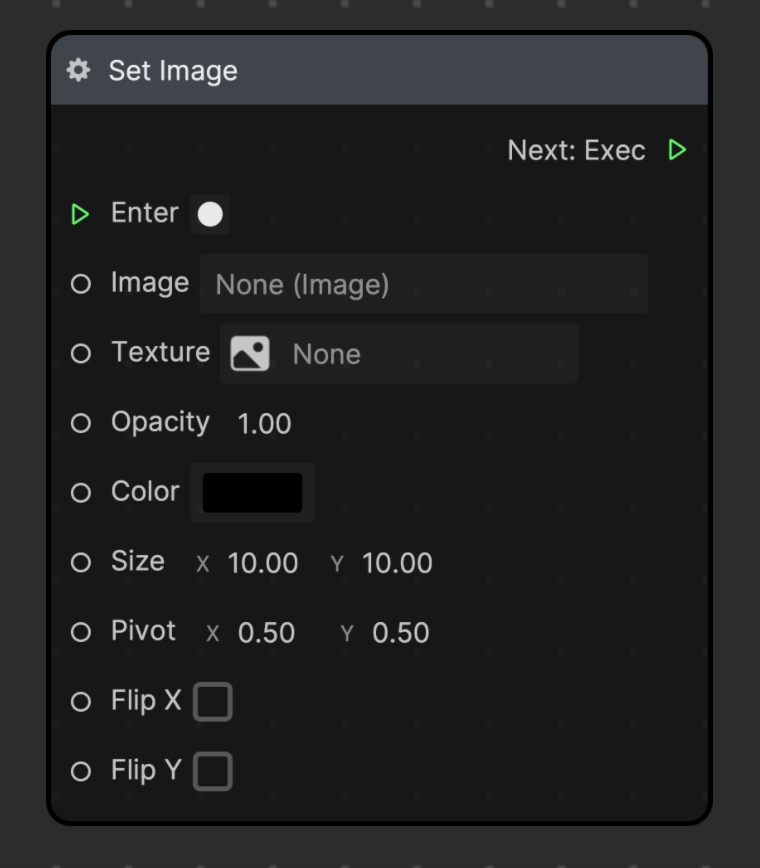
Nodes have ports, which you can link to form connections. Input ports, located on the left side of the node, are used to receive data or commands. Output ports, located on the right side, pass data or commands to the next node.
Ports can either be control ports or data ports.
- Control ports, indicated by green triangles, are used to form connections that command the next node to perform its function
- Data ports allow transfer of data and are symbolized by gray circles
Nodes may exclusively contain control ports, data ports, or both.
Connecting Nodes
Nodes are linked together by connections, which are pathways between ports that dictate how data or commands flow from one node to another. Connections determine the sequence of operations, as logic flows through connections from left to right.
In visual scripting, you essentially create a program by arranging nodes and connecting them. Think of nodes as tasks you want to accomplish, and connections as the order in which you want to accomplish them. Together, nodes and connections form a visual map of a process or logic flow.
As logic flows through connections from left to right, ports on the left side are inputs, while ports on the right side are outputs.
Tour of the Visual Scripting Panel
The Visual Scripting panel is where you can create and manage your visual scripting graphs. It is composed of the Visual Scripting toolbar and the dotted space where you can build your graphs.
Visual Scripting Toolbar
The Visual Scripting toolbar contains features that help you navigate the space and manage node controls.
| Icon | Name | Description |
|---|---|---|
 | My Items | Add variables and manage subgraphs |
 | Minimap | Gives you a bird’s-eye view of the entire panel, allowing you to quickly navigate through sprawling graphs |
 | Reset | Resets the view to its default, center position |
 | Reset on Record | Resets the effect whenever the record state is triggered. Selecting Reset on Record Off will default to the visual scripting setup |
 | Search | Search for existing nodes or subgraphs by name |
 | Details | Adjust the parameters of the selected node, when possible |
 | Comment | Select multiple nodes and add a comment box surrounding them. This button is grayed out until nodes are selected. |
 | Add node | Opens the Node menu |
 | Undock | Undocks the Visual Scripting panel into a separate window |
Dotted Space
The dotted space is where you can create your visual scripting graphs. To zoom in and out of the dotted space, pinch or scroll on your trackpad or mouse. To navigate around the dotted space, hold the Control key on your keyboard and drag your cursor.
In addition to clicking the Add node button in the toolbar, you can also access the Node menu by double-clicking anywhere in the dotted space, right-clicking anywhere in the dotted space then selecting Add node.
To delete multiple connections at once, hold the Shift key and drag your cursor through the connections.
Key Terms
- Node
- Ports
- Input
- Output
- Control port
- Data port
- Connection
- Visual Scripting toolbar
- Dotted space
Next Steps
Learn how to manage subgraphs and add straightforward interactions to effects in the next module.